

Know what your freight
should actually cost.
You're quoted a number and asked to trust it. Bulk Insights gives you an independent benchmark built from settled freight, plus a view across modes that general rate tools simply don't offer.
- truck, rail, barge, vessel
- 4 modestruck, rail, barge, vessel
- of settled freight data
- 14 yrsof settled freight data
- commodities covered
- 33commodities covered
An independent read, not a vendor's word
Every quote you receive comes from someone with a position in the outcome. Bulk Insights doesn't. It reports what bulk freight has actually settled at across the BulkLoads network, so you can tell the difference between a fair number and an opportunistic one, and budget the lane before you go to market.
Comparing modes on the same freight is something almost no general TMS or rate tool will show you.
Built for how you actually work
- 01
Multi-modal cost comparison
Compare what the same freight costs by truck, rail, barge, and vessel. Most general TMS and rate tools price a single mode and leave the trade-off invisible.
- 02
Validate carrier pricing
Hold every quote you receive against an independent benchmark drawn from settled freight rather than a vendor's own book.
- 03
Confidence scoring
Each benchmark tells you how closely the comparable freight matches your lane, so a thin lane never gets presented as a firm number.
- 04
Commodity trends
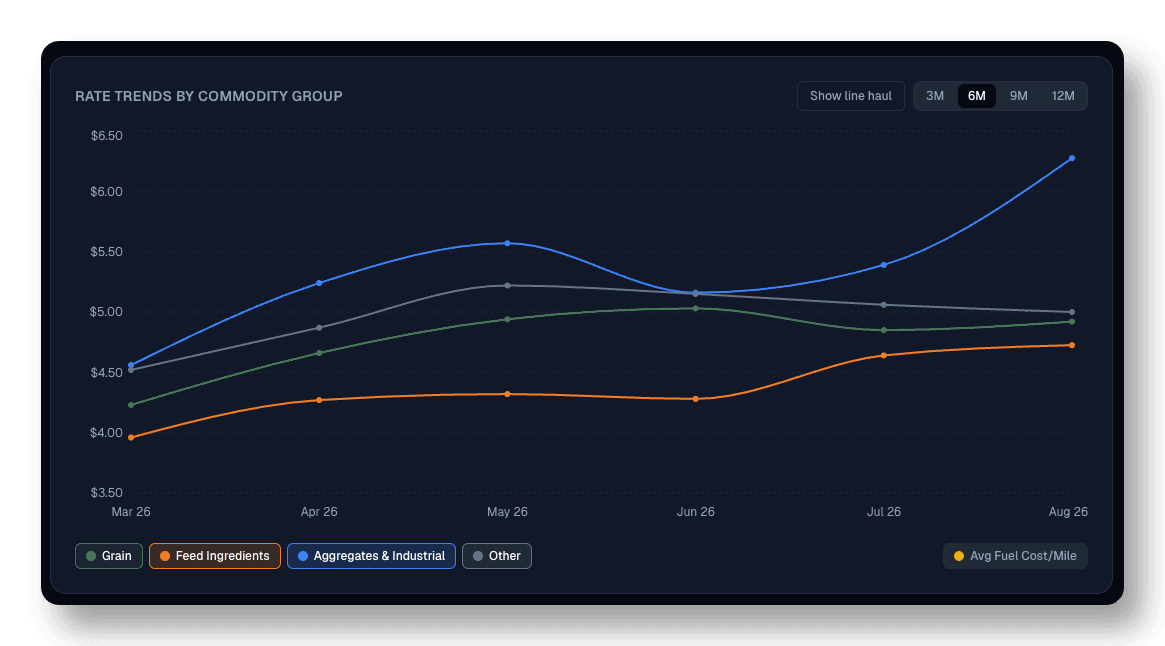
Rate movement by commodity group over 3 to 12 months: the context you need when planning a season, not just a load.
- 05
Budget lanes with real numbers
Build freight budgets on what the market has actually paid, then test them against what carriers come back with.
- 06
Regional market context
See where capacity is tight and where it isn't, so you know whether a quote reflects the market or the moment.
- 07
Build and score an RFP
Set realistic targets on every lane before the bid goes out, then hold the responses that come back against the same benchmark. You learn which lanes are priced to attract capacity and which will sit unawarded.
Plan the season, not just the load
Rate movement by commodity group over 3, 6, 9, or 12 months. Grain, feed ingredients, aggregates and industrial each track on their own line, so you can time a bid and build a freight budget against where your market is actually heading.
- Compare commodity groups on a single chart
- Zoom the window from three months to a full year
- Budget and time bids against real movement
Priced for how you use it
Per user, per month. Add people as you need them, and a larger team moves every seat onto a lower rate.
Pricing + Analytics
Everything in Pricing, plus market analytics, commodity and load heatmaps, and volume trends.
$20 less per user at 4 or more
- Rate estimates
- Fuel prices
- Operating cost
- Year over year rates
- Commodity heatmap
- Commodity momentum
- Commodity trends
- Load heatmap
- Load volume
- Mileage band rates
- Regional activity
- Year over year overlay
Pricing + Analytics + Capacity Procurement
Everything in Pricing and Analytics, plus equipment and carrier heatmaps, carrier discovery, and RFP bidding.
$50 less per user at 4 or more
Everything in Pricing and Analytics, plus
- Carrier discovery
- Request for proposal bidding
- Equipment heatmap
- Carrier heatmap
Prices in USD, billed monthly. Self-serve covers up to 6 users; for a larger team call 1-800-518-9240 and we will put together a plan that fits.